Key Takeaways
- The only website KPIs worth executive attention are those tied to pipeline, revenue, and customer lifetime; everything else is a diagnostic metric or a vanity metric.
- Marketing leaders should focus on marketing qualified leads, sales qualified leads, and conversion rates by source rather than raw website traffic totals.
- Engagement metrics, lead quality, and customer lifetime value must be viewed together using analytics tools and CRM data, not isolated in channel-specific silos.
- Regularly reviewing a focused KPI set (fewer than 10 metrics) in clear marketing reports is how you align digital marketing activity with business goals.
- B2B marketing leaders need to track KPIs connecting traffic to pipeline and revenue; without that link, reporting is noise.
Introduction: Why B2B Website KPIs Matter in 2026
B2B buying cycles in 2026 stretch from 3 to 12 months. Multiple stakeholders (technical leads, finance directors, procurement) visit your site at different times, on different pages, for different reasons. The journey is non-linear, and a single conversion event rarely tells the full story.
This guide is written for marketing leaders, not channel specialists. It focuses on website KPIs that influence revenue decisions: budget allocation, headcount requests, campaign bets. B2B sites must be measured differently from B2C because success is about pipeline quality and deal velocity, not checkout volume.
Consider a CIO-led buying committee evaluating an analytics platform. One member reads a case study in April. Another checks the pricing page in May. A third watches a product tour in June. Only then does someone fill the demo form. The website KPIs that matter capture this entire customer journey, not just the form submission.
The sections below provide concrete KPI lists, example benchmarks, and sample tables you can adapt for your own marketing dashboards.
Defining B2B Website KPIs vs Metrics vs Vanity Numbers
A key performance indicator is a metric directly tied to a business decision or target. For example, MQL-to-SQL conversion rate is a KPI when it determines whether marketing spend shifts from one channel to another. Revenue metrics connect marketing activities to financial outcomes. Pipeline metrics show how marketing contributes to future sales.
An operational metric (page views, scroll depth, time on page) is useful for diagnosis but rarely belongs in an executive meeting. A vanity metric (total impressions, social media followers, unqualified traffic spikes) looks good in a screenshot but carries no pipeline signal.
Website traffic should focus on quality rather than just volume to measure business outcomes.
| Type |
Example |
CMO Use |
| KPI |
Demo-to-opportunity rate by source |
Decides channel budget allocation |
| KPI |
Marketing sourced pipeline value |
Justifies marketing investment to the board |
| Operational Metric |
Average session duration on pricing page |
Diagnoses content issues; stays in team dashboard |
| Vanity Metric |
Total page views across all pages |
Ignore unless segmented by ICP and tied to outcomes |
| Vanity Metric |
Raw social media engagement counts |
Ignore for pipeline decisions |
- Avoid treating “more traffic” as a goal. Segment by ICP fit and link to conversion outcomes before reporting to leadership.
- Use concrete B2B scenarios (pricing page visits from target accounts, demo requests from a specific industry) instead of abstract percentages when presenting KPIs.
Align Website KPIs With Business Goals
If the company’s goal is “add $4M in new ARR from mid-market accounts in 2027,” every website KPI should trace back to that number. KPI selection starts with the business target, not with whatever Google Analytics happens to display by default.
Map high-level objectives to specific website KPIs:
- New customer acquisition goal: track demo requests from 100-500 employee companies, SQL rate from those demos, closed-won revenue from website-originated opportunities.
- Expansion revenue goal: track self-service upsell page visits from existing customers, expansion pipeline from product content hubs.
- Churn reduction goal: track knowledge base engagement, support page usage patterns, and renewal-related content visits.
Average deal size is a critical KPI for assessing revenue outcomes; it determines how many deals you need from the website to hit your number.
| Business Goal |
Primary Website KPI |
Supporting Metrics |
| Add $4M mid-market ARR |
Website-sourced pipeline from 100-500 emp. accounts |
Demo requests, SQL rate, pricing page visits by segment |
Keep fewer than 10 KPIs on any one leadership dashboard. More than that dilutes focus and slows decision-making.
Traffic and Acquisition KPIs: Who Is Actually Reaching Your Site
In B2B marketing, acquisition KPIs are about the right visitors, not total volume. Quality of website traffic matters more than quantity in B2B. Target account traffic measures visitors from ideal customer profiles or target account lists.
Key traffic KPIs for marketing leaders:
- Sessions by source/medium (organic search, direct traffic, paid search, paid channels, referrals)
- Organic traffic trend month-over-month
- Direct traffic trend (rising direct traffic often signals stronger brand and word-of-mouth)
- Paid search vs paid social click volume and cost
- Referral traffic from partner sites and industry directories
Tracking traffic sources helps optimize B2B marketing strategies. Segment traffic by company size, industry, and region using analytics tools connected to your CRM or reverse-IP identification platforms. Website traffic data reveals B2B marketing performance only when it is filtered by these dimensions.
Organic traffic and share of voice measure brand visibility relative to competitors. B2B buyers spend more time online than in meetings, which means your site is often the first (and longest) interaction a potential customer has with your brand.
For reference, a 50-person B2B SaaS company with active content marketing and paid channels might see 15,000 to 40,000 monthly sessions. The number itself matters less than how many of those sessions come from your target audience.
Engagement Metrics: Are Visitors Actually Interested
Engagement metrics help distinguish casual visitors from real buying committees researching a purchase. Engagement metrics reveal whether site content captures visitor attention or drives quick exits.
Core engagement metrics to track:
- Engagement rate or engaged sessions from GA4 (engaged sessions indicate high-quality website traffic)
- Average session duration on solution and pricing pages; average engagement time indicates level of content consumption versus quick exits
- Pages per session for known accounts
- Scroll depth on key content marketing assets (guides, whitepapers, comparison pages)
- Repeat visits within a 30-day window from the same company or account
- Bounce rate, which measures percentage of single-page sessions without interaction, indicating content mismatch
Higher engagement on bottom-of-funnel pages (pricing page, case studies, product tours) correlates with better lead quality. A target account viewing four pages including pricing converts to opportunity at a higher rate than an anonymous visitor bouncing from a blog post.
Engagement metrics are leading indicators. They must be paired with pipeline data before influencing large budget moves. A later section includes a comparison table contrasting engagement between target accounts and non-target traffic.
Conversion Rates: From Visitor to Lead to Opportunity
Conversion rates across stages are the most actionable b2b marketing KPIs on your website. Conversion rate measures the percentage of visitors taking desired actions on the site. Conversion rate assesses how well a website turns interest into identifiable demand.
Essential conversion KPIs:
- Visitor-to-lead conversion rate (all form submissions)
- Visitor-to-demo request rate
- MQL-to-SQL conversion, which tracks the percentage of MQLs accepted as SQLs
- Opportunity creation rate from demo requests (demo-to-opportunity)
- Opportunity-to-closed-won rate for website-influenced deals
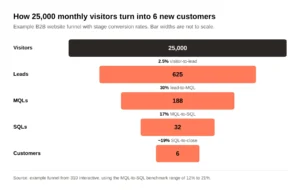
MQL-to-SQL conversion rates typically range from 12% to 21%. Lead-to-customer conversion rates typically range from 2% to 5%, depending on ACV and sales cycle length. Lead-to-customer conversion rate indicates sales funnel effectiveness.
Average deal size impacts conversion rates in B2B marketing. Enterprise deals ($100K+ ACV) close at lower percentages than SMB deals, but each closed deal carries more revenue.
| Funnel Stage |
Example Volume (Monthly) |
Stage Conversion Rate |
Cumulative Outcome |
| Visitors |
25,000 |
– |
– |
| Leads (all forms) |
625 |
2.5% visitor-to-lead |
625 leads |
| MQLs |
188 |
30% lead-to-MQL |
188 MQLs |
| SQLs |
32 |
17% MQL-to-SQL |
32 SQLs |
| Customers |
6 |
~19% SQL-to-close |
6 new customers |
Conversion rates can be improved by optimizing landing page elements. One company reduced form fields from 6 to 3 and saw a 10-15% lift in demo request submissions. Small conversion gains on high-intent pages usually outperform large traffic increases in revenue impact. Tracking conversion rates helps identify issues in the sales funnel before they compound downstream.
Lead Generation KPIs: Volume, Quality, and Source
Lead numbers mean nothing without clear quality and source tracking. Reporting total leads generated without context is how vanity metrics creep into marketing reports.
Website lead KPIs to track:
- Number of form submissions by type (demo request, contact sales, content download, newsletter)
- Number of hand-raiser leads (demo, pricing, “talk to sales”) vs low-intent newsletter signups
- Split of leads by source: organic search, direct traffic, paid search, referral, partnerships
- Share of leads from target accounts (ICP match rate)
Use hidden UTM fields and your marketing automation platform to preserve lead source and marketing campaign data for later pipeline analysis. This ensures every lead carries its origin story into the CRM, where you can measure how much revenue each source produces.
Leads from organic search typically convert better than paid leads. Higher quality leads often come from direct marketing efforts such as branded search and referral programs. Lead quality can be assessed by lead scoring and mapping behaviors to purchase intent.
Marketing reports to leadership should highlight qualified leads tied to pipeline, not just total lead volume. A later section includes a comparison table contrasting total leads vs qualified leads by channel.
Marketing Qualified Leads (MQLs) and Sales Qualified Leads (SQLs)
Marketing qualified leads are website visitors who meet behavioral and firmographic thresholds indicating purchase interest. Sales qualified leads are MQLs that the sales team has vetted and confirmed as real opportunities worth pursuing.
MQL criteria based on website behavior:
- Multiple visits to solution pages within 14 days
- Viewing the pricing page and at least one case study
- Downloading a high-value guide or ROI calculator
- Using a business email from a target industry or company size band
SQL criteria involve the sales process:
- Confirmed fit against ICP profile (company size, budget, use case)
- Confirmed need and timeline from a discovery call
- Positive response to sales outreach within a defined SLA (e.g., 48 hours)
Sales-qualified opportunities (SQOs) indicate leads likely to convert into paying customers. MQL-to-SQL conversion rates range from 12% to 21%, which means roughly 4 out of 5 MQLs do not pass the sales team’s bar.
Track MQL and SQL counts, conversion rates, and average time between stages as central website KPIs. In 2025, one mid-market SaaS company recalibrated its MQL scoring after discovering that 60% of “MQLs” were content-only downloaders with no purchase intent. After tightening criteria to require at least one pricing or demo page visit, MQL volume dropped 40% but MQL-to-SQL conversion jumped from 14% to 28%, and the sales team stopped complaining about lead quality.
Lead Quality KPIs: Beyond Volume
Lead quality is a critical website KPI that cannot be inferred from volume alone. Lead quality is crucial for improving sales conversion rates, and measuring it requires connecting website data to CRM outcomes.
Ways to measure site-driven lead quality:
- Percentage of MQLs accepted by the sales team (sales acceptance rate)
- Percentage of leads that progress to sales qualified opportunities (SQO rate)
- Win rate for opportunities that originated from the website
- Average deal size by lead source and landing page
Multi-touch attribution helps understand which content influences pipeline and revenue. Track lead quality by content type: comparison pages, product pages, and case studies tend to produce higher-quality leads than generic blog posts.
| Source |
Monthly Leads |
MQL Rate |
SQL Rate |
Close Rate |
Avg Deal Size |
| Organic search |
180 |
35% |
20% |
22% |
$38,000 |
| Direct traffic |
95 |
42% |
25% |
26% |
$45,000 |
| Paid search |
240 |
22% |
13% |
15% |
$28,000 |
Improving lead quality usually requires reducing low-intent offers (gated blog PDFs, generic checklists) and strengthening bottom-funnel assets like product comparisons, ROI calculators, and interactive demos.
Pipeline and Revenue KPIs Influenced by the Website
Website behavior connects directly to pipeline value and revenue when CRM data serves as the source of truth.
Key pipeline KPIs:
- Marketing sourced pipeline: the dollar value of pipeline generated from website leads
- Pipeline contribution measures the dollar value of pipeline generated from website leads, serving as one of the clearest indicators of marketing performance
- Marketing-influenced pipeline: deals where the website played a role at any point in the journey, even if it was not the first or last touch
- Number of sales qualified opportunities coming from key landing pages (demo, pricing, product tour)
- Average sales cycle length for website-sourced deals vs other sources
Revenue KPIs:
- Closed-won revenue attributed to website leads
- Win rate of website-influenced opportunities
- Revenue per demo request or per high-intent form fill
- Marketing-influenced revenue shows marketing’s impact on sales across the entire sales funnel
- Marketing ROI connects revenue generated by website deals to marketing investments
Pipeline sourced from the website tracks dollar value generated from website leads. Account engagement metrics measure activity from target accounts during the buying cycle. These KPIs belong in executive marketing reports monthly or quarterly, not in daily standups.
Customer Lifetime Value, Retention, and Expansion KPIs
Customer lifetime and retention determine whether the accounts your website attracts are worth the acquisition cost. Customer lifetime value measures total revenue from a customer across the entire relationship. A higher CLV indicates more revenue potential from customers.
CLV helps evaluate the effectiveness of customer acquisition strategies. It is calculated using average transaction size, retention period, and margin. In B2B, one customer can lead to years of repeat business, making CLV the metric that separates a good lead source from a great one.
Retention and expansion KPIs influenced by website usage:
- Renewal rate of website-generated customers vs outbound-generated customers
- Expansion revenue (cross-sell, upsell) from existing customers using self-service product content
- Monthly recurring revenue growth from customer-only content hubs and product education pages
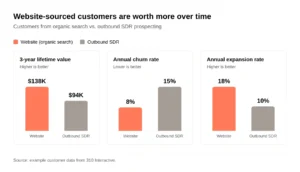
| Acquisition Source |
Avg First-Year ACV |
3-Year CLV |
Annual Churn Rate |
Expansion Rate |
| Website (organic search) |
$42,000 |
$138,000 |
8% |
18% |
| Outbound SDR |
$36,000 |
$94,000 |
15% |
10% |
A slightly higher customer acquisition cost from website leads can be justified if those customers demonstrate higher customer lifetime and expansion potential. The table above illustrates why total revenue over three years, not first-deal size alone, should inform channel investment.
Channel and Source Performance: Organic Search, Direct, and Paid
Channel-level KPIs must roll up to business goals instead of living in separate marketing dashboards owned by separate teams.
How to evaluate each channel:
- Organic search: traffic, conversions, MQLs, SQOs, revenue contribution. Organic search visitors converting to demo requests average around 2.1%, while PPC overall may produce approximately 0.7%.
- Direct traffic: brand strength indicator, word-of-mouth signal, offline marketing campaign effect. Compare against high-intent conversion events.
- Paid search and paid social: cost per MQL, cost per SQO, ROI. Brand keyword ads can convert at 8-15% on demo pages, while cold paid social often falls to 1-3%.
- Referrals and partner traffic: conversion rates and deal size; often small volume but strong pipeline value.
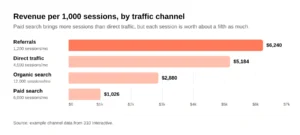
| Channel |
Monthly Sessions |
MQL Rate |
SQL Rate |
Avg Deal Size |
Revenue per 1,000 Sessions |
| Organic search |
12,000 |
2.8% |
0.6% |
$40,000 |
$2,880 |
| Direct traffic |
4,500 |
3.5% |
0.9% |
$48,000 |
$5,184 |
| Paid search |
6,000 |
1.9% |
0.3% |
$30,000 |
$1,026 |
| Referrals |
1,200 |
4.1% |
1.0% |
$52,000 |
$6,240 |
Content marketing and SEO marketing efforts should be assessed primarily through pipeline and revenue KPIs, not only rankings or impressions. One B2B consulting firm found that organic search generated 30% fewer leads than paid search but produced 55% more closed-won revenue because the organic leads had stronger ICP fit and shorter long sales cycles.
Core Analytics Tools and Data Infrastructure for Website KPIs
Tool selection matters less than having clean analytics data and solid definitions shared across teams.
Essential tools and systems:
- Google Analytics (GA4) or similar web analytics for engagement metrics, session data, and on-site behavior
- CRM (HubSpot, Salesforce) as the revenue source of truth for pipeline, revenue, and customer lifecycle stages
- Marketing automation platform (Marketo, Pardot, HubSpot) capturing form submissions, email engagement, and lead scoring
- BI or dashboard tools (Looker, Tableau, Power BI) for unified marketing reports across web, CRM, and ad platforms
- Google Search Console for organic search performance, keyword visibility, and indexing health
Critical data practices:
- Consistent UTM tagging across every marketing campaign
- Standardized lifecycle stages: lead, MQL, SQL, opportunity, customer
- Connecting website events to CRM contacts and accounts for full-funnel tracking
- Monthly data quality checks and shared naming conventions
A mid-market B2B company in 2025 consolidated five separate channel reports (GA4, LinkedIn Ads, Google Ads, HubSpot email, Salesforce pipeline) into a single BI dashboard. The process took 6 weeks and revealed that 22% of their “MQLs” were duplicate records from the same accounts filling forms on different pages.
Building Useful Marketing Reports for Website Performance
Most B2B marketing reports overemphasize impressions and clicks while burying the numbers that drive marketing strategy decisions. Marketing performance reporting only works when it answers: what changed, why it changed, and what decision should follow.
Best practices for website KPI reporting:
- Cap dashboards at a focused KPI set linked to business goals (5-7 metrics for executives)
- Avoid mixing raw metrics (page views, impressions) into C-level summaries
- Use trend lines (month-over-month, year-over-year) to show direction, not just snapshots
Create separate views by audience:
- Executives: pipeline value, revenue, customer acquisition cost, customer lifetime value, win rate
- Marketing leadership: MQLs, SQLs, conversion rates, lead quality, campaign performance
- Channel owners: engagement metrics, ad spend efficiency, keyword rankings, social media engagement
Customer Acquisition Cost measures total sales and marketing spend divided by new customers. CAC is calculated by dividing total acquisition costs (including sales team salaries, ad spend, tools, and overhead) by the number of new customers acquired. A lower CAC indicates more efficient customer acquisition strategies. Rising CAC can signal issues in lead quality or sales processes. CAC should be analyzed over the long term for better insights; quarterly or annual trends are more meaningful than monthly spikes.
| KPI |
Current Month |
Prior Month |
MoM Change |
Target |
| Website-sourced pipeline |
$820K |
$740K |
+10.8% |
$900K |
| MQL-to-SQL rate |
18% |
16% |
+2pp |
20% |
| Website CAC |
$4,200 |
$4,500 |
-6.7% |
$4,000 |
| CLV (website source) |
$138K |
$135K |
+2.2% |
$140K |
| SQL win rate |
22% |
20% |
+2pp |
25% |
Common Mistakes Marketing Leaders Make With Website KPIs
- Optimizing for total leads instead of qualified leads and SQLs. One SaaS company celebrated a 40% increase in leads generated from a gated ebook campaign. Pipeline from those leads: zero. The sales team marked 94% as “no fit.”
- Treating website traffic growth as success without pipeline validation. Traffic doubled after a viral blog post; pipeline stayed flat because the new visitors were students, not potential customers in the target audience.
- Reporting channel tool numbers without reconciling to CRM data. Google Ads reported 120 conversions; Salesforce showed 83 new leads from paid search in the same period. The gap came from bot clicks and duplicate form submissions.
- Tracking too many marketing KPIs. A 40-metric dashboard creates confusion, not clarity. No one acts on insight number 37.
- Ignoring downstream metrics like customer lifetime and churn. Marketing teams that stop measuring at MQL miss the feedback loop that tells them whether they attracted the right accounts.
Practical fixes:
- Redefine MQL criteria jointly with sales leadership; require at least one high-intent page visit
- Add a “How did you hear about us?” field to improve lead quality tracking and attribution
- Consolidate redundant metrics into a single KPI per objective
- Review every metric on your dashboard and ask: “What decision does this change?” If the answer is nothing, remove it
Example KPI Tables for a B2B Website Dashboard
These tables can be adapted directly into your marketing dashboards.
Funnel performance table:
| Stage |
Monthly Volume |
Stage Conversion Rate |
Example Target |
| Website visitors (ICP) |
18,000 |
– |
20,000 |
| Leads (all forms) |
540 |
3.0% |
600 |
| MQLs |
162 |
30% |
180 |
| SQLs |
29 |
18% |
36 |
| New customers |
5 |
17% |
7 |
Channel comparison table:
| Channel |
Sessions |
MQL % |
SQL % |
Avg Deal Size |
Revenue / Session |
| Organic search |
10,500 |
3.1% |
0.7% |
$42,000 |
$3,087 |
| Direct traffic |
3,800 |
4.0% |
1.0% |
$50,000 |
$5,000 |
| Paid search |
5,200 |
2.0% |
0.3% |
$28,000 |
$840 |
| Referrals |
900 |
4.5% |
1.2% |
$55,000 |
$7,920 |
KPI scorecard template:
| KPI Name |
Owner |
Review Cadence |
Decision It Informs |
| Website-sourced pipeline ($) |
VP Demand Gen |
Monthly |
Channel budget allocation |
| MQL-to-SQL conversion rate |
Marketing Ops |
Monthly |
Lead scoring recalibration |
| Website CAC |
CMO / Finance |
Quarterly |
Marketing investment efficiency |
| CLV by website source |
RevOps |
Quarterly |
Channel mix and retention strategy |
| SQL win rate (website leads) |
Sales + Marketing |
Monthly |
Sales process and targeting adjustments |
| Revenue per demo request |
VP Demand Gen |
Monthly |
Demo page and follow-up optimization |
Implementing and Iterating on Your Website KPI Framework
A 90-day roadmap for putting these KPIs in place:
Days 1-30: Foundations
- Align marketing team and sales leadership on MQL, SQL, and SQO definitions
- Audit UTM tagging and fix inconsistencies across all active campaigns
- Pull baseline numbers for each KPI from CRM and Google Analytics
- Document formulas and owners for every metric
Days 31-60: Build and segment
- Configure website goals and events in GA4 matching your funnel stages
- Build first unified dashboards in your BI tool connecting web, CRM, and marketing automation data
- Start segmenting traffic and leads by ICP criteria (company size, industry, region)
- Track account level engagement for your top 100 target accounts
Days 61-90: Optimize and adjust
- Review first full month of trended data; identify the weakest conversion point in your funnel
- Run one or two small experiments on high-intent pages (e.g., simplify demo form, add social proof to pricing page)
- Adjust KPI targets based on actual baselines, not industry averages
- Present first executive KPI scorecard and gather feedback
Revisit your KPI set at least annually or whenever there is a change in go-to-market motion, pricing model, or target market. Document every definition change so year-over-year comparisons remain meaningful.
The website is only one part of the B2B journey, but its KPIs often provide the clearest early signals of pipeline health. Start with clean definitions, build honest tracking, and iterate quarterly. The marketing leaders who do this well are the ones who can answer “how much revenue did the website generate?” with a precise number, not a guess.
Frequently Asked Questions
These questions cover topics not fully addressed in the sections above.
How often should a B2B marketing leader review website KPIs?
Operational metrics like traffic by source, click-through rates, and form error rates can be monitored weekly by the marketing team or channel owners. Core KPIs such as MQL volume, MQL-to-SQL conversion, and website-sourced pipeline belong in monthly reviews with marketing, sales, and RevOps present.
Revenue and customer lifetime value KPIs fit quarterly reviews because long sales cycles and renewal rhythms make monthly data noisy. Avoid daily KPI reviews at the executive level; short-term fluctuations trigger unnecessary strategy changes. A recurring monthly “website KPI” meeting with cross-functional stakeholders keeps everyone aligned without creating meeting fatigue.
What is a good conversion rate for a B2B website?
Acceptable conversion rates vary by industry, ACV, and offer type, so benchmarks are directional rather than prescriptive. Visitor-to-lead conversion for general B2B websites typically falls between 1% and 3%. High-intent pages like “Request a Demo” can convert at 8-15% for top-quartile companies when traffic is well-qualified.
Quality matters more than percentage: a 2% conversion rate from ICP-fit accounts often produces more pipeline than a 6% rate from unqualified visitors. Track conversion separately for brand traffic, organic search, and paid campaigns to find where optimization brings the biggest revenue lift.
How many website KPIs should appear in an executive marketing report?
Limit executive-level website KPI reporting to 5-7 core key metrics that connect to pipeline and revenue. Good candidates: website-sourced pipeline, website-influenced revenue, MQL-to-SQL conversion rate, SQL win rate, CAC from website leads, and average customer lifetime value by source.
Secondary operational metrics (page views, bounce rate, scroll depth) belong in team-level dashboards used by analysts and channel owners. Tight KPI focus improves decision-making and makes it easier for CEOs and boards to see marketing’s real impact without wading through noise.
How do I know if my website is attracting the right audience?
Segment traffic and leads by ICP criteria (company size, industry, region, job title) using CRM data and account-level tracking tools. A high share of MQLs and SQLs from organic search and direct traffic usually signals good audience alignment. Monitor engagement metrics on solution, pricing, and case study pages for target accounts specifically.
If pipeline and win rates are weak despite strong traffic, the website is either attracting the wrong visitors or delivering messaging that does not match potential customer behavior. ICP-fit demos converted to opportunity at 47.4% versus 11.2% for non-ICP in one study of 18,400 demos, illustrating how audience quality drives every downstream metric.
When should we change our website KPI set?
Revisit KPI definitions when the company changes its business model, launches a new product line, shifts from sales-led to product-led growth, or enters new geographic markets. Frequent changes confuse teams and break trend comparisons, so limit major adjustments to once or twice per year. Pilot new KPIs in team dashboards for at least one quarter before promoting them to executive reports. Preserve historical KPI data and document every definition change so that actionable insights from year-over-year comparisons remain valid.